Reports, stories and reflections from U-M Library assessment practitioners.
Tiny Studies

Posts in Tiny Studies
Showing 21 - 30 of 77 items

Collaboration with students on library assessment projects is rewarding, both for the student and for the library. Student learning is front and center during any assessment project where the student is involved as a fully engaged team member. This post shares some thoughts about teaming up with students on assessment efforts.

University of Michigan Press is exploring different ways of communicating the “impact” of the open access program, Fund to Mission, with impact defined as “provable benefits on the real world.” As part of this exploration, the Press worked with Zhenkun Lin, a doctoral student from the U-M College of Engineering, under the auspices of the Rackham Doctoral Internship initiative. The charge for Zhenkun’s project was very broad: Please explore the data we have gathered and see if it suggests any interesting patterns or opportunities for visualizing the program’s impact.
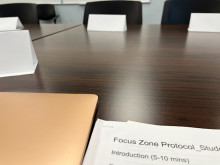
In Fall 2022, the Library Environments department began a pilot of two designated “zoned” spaces in response to user feedback asking for more information about what to expect from a study space. We conducted focus groups and integrated participatory design to learn about how users are perceiving and experiencing these labeled spaces.
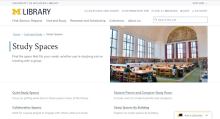
As students, we all know the struggle of trying to find the perfect study space on campus. The Library Environments UX Research Team and the Library Information Technology Design and Discovery (D&D) Team worked together to improve the user experience of the Library’s study spaces booking website.
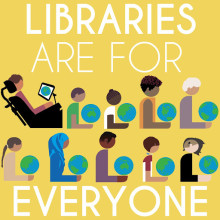
A subcommittee of the Library Diversity Council was charged to evaluate and interrogate the role of policing in the University of Michigan Library. This post explores the evaluation and decision-making processes, while identifying the labor that goes into projects dealing with anti-racist culture change. The group’s research resulted in several recommendations shared with library leadership.
The University of Michigan Library’s efforts to develop our digital preservation program created an opportunity to request additional support during the annual budget cycle. With only a few months to draft recommendations, the Digital Preservation Steering Committee performed an assessment survey to gather feedback from stakeholders across the library.

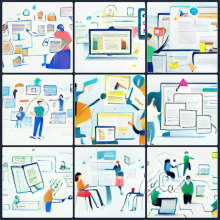
A redesign of the library blogs platform kicked off last fall with time dedicated to understanding the current site and its usage, reviewing what other libraries do, and conducting a needs assessment survey with stakeholders. This approach has allowed efficient decision making and informed requirements, while engaging stakeholders early in the redesign process.
The University of Michigan Library is home to a vast collection of materials representing dozens of languages. U-M Library Catalog Search, however, can cause difficulties for users searching for materials in languages other than English. In Summer 2021 we conducted an exploratory study on the experience of searching for non-English materials within U-M Library Catalog Search in order to better understand challenges users face, how they overcome them, and what we can do to mitigate the problem.
Have you ever done a one-shot instruction session and thought, “I’m overwhelmed with the amount of information I talked about and I’m a librarian. I wonder how the students feel?” I felt that after teaching several capstone engineering courses. So I decided to create a series of videos instead. This blog post describes what I learned about students’ library learning preferences.
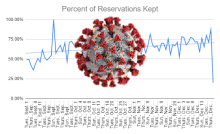
The interruption to library services caused by COVID-19 meant we needed to quickly develop new data collection strategies to give us information to manage our modified services for the 2020-2021 academic year. It also gave us an opportunity to conduct a deep reflection and assessment of how our regular collection had been going, and to be ready to make changes as we reinstituted more regular services. In two posts, we describe the evolution of our data collection efforts.