The interruption to Library services caused by the COVID-19 pandemic meant we needed to develop new data collection and assessment strategies for our library spaces. [See Adapting Operations Data Collection in Response to COVID-19 (Part 1) for background information.]
Reflection and Assessment
This pause in normal Library operations and the associated data collection also gave us an opportunity to reflect on how our data program had been going so far, and to assess what was and wasn’t working so that we could make any changes before we resumed more regular operations.
We started by creating a timeline documenting what we had already done. We searched our files for planning documents, reports and assessments we had created along the way, and organized them in an online whiteboard tool by time and data collection type. This helped us see the work we had already done in context and accurately remember how the program had changed over time.
We then had a series of structured reflective conversations about what had happened, what we learned, and what we might do about it.
Some of lessons we learned from these conversations were:
- We learned a lot from the program - but some of the value was diminishing. We learned a lot from our efforts, both about how to collect, clean and present the data, and about what was happening in our spaces, at our desks and with our collections, but some of these things we didn’t need to keep collecting in the same ways because we had learned all that we could. We had already stopped doing in-depth Suma initiatives before the pandemic because the effort involved wasn’t matched with the value of new information we could gain. We wanted to make sure when we restarted our full data collection program we were being intentional about collecting what we could still learn from, instead of just collecting what we had in the past.
- Balancing comprehensiveness with effort and accuracy was key. Some of our data collection could be quite labor intensive for the staff who had to collect it. The more detailed we wanted the data to be, the more work it took to collect it. This meant the busier staff were helping patrons, the more likely there were to be gaps in our data, because no one could be spared from a service desk to take a headcount, or because the extra work of tracking all the specifics of an interaction with a patron at a desk took extra time and focus, when there was a line of patrons waiting. We wanted to make sure that going forward we were balancing the level of detail we actually needed, with the work it took to accurately collect at that level of detail.
- We didn’t need data collection to line up across libraries. As a part of building a comprehensive program, we had previously worked to align collection efforts across our divisional libraries. Locations used the same Desk Tracker form, even though not all types of interactions happened at all desks. For example, not every desk has a hold shelf, but “hold pick up” was one of the choices. Additionally, having every location collect gate counts on the same schedule didn’t make sense, since not all locations were open at the same hours. It actually made analyzing the data more difficult, and being able to compare mid day traffic between locations didn’t seem to actually be useful.
- A focus on what’s useful for service improvements is important. One useful aspect of our data collection during the 2020-2021 academic year was that there was a tight link between what we collected, and what we needed to know to make decisions about our services. The pandemic constrained the scale of our operations, so we could collect more comprehensive data about them, and because we knew we may have to change them as we went, we were attentive about collecting with specific decision making in mind. Our initial goals for the Operations Data Program had been focused on learning more about what was happening broadly, but now that we had, we wanted to make sure the program was focused on collecting data that was useful for specific decision making going forward.
Going Forward: Right-sized, Decision-focused
In the Fall 2021 semester we started the first phase of our new Operations data program, which is focused on “right-sized collection” of data that will be useful for managers at each service point to make decisions.
New Desk Interactions forms
In the past we used a Desk Tracker form that asked service point staff to categorize every interaction they had with patrons. Moving forward we are using Qualtrics forms to track service desk interactions. We are pulling data from our ILS (Alma) about circulation transactions, so staff don’t need to manually log them, and other types of interactions are only tracked if a manager has a use for the data. Each location has its own form, customized to collect the data useful to that location. In most locations this means the form has gone from 24 choices to less than 4.
![]()
An example of an old Desk Tracker form
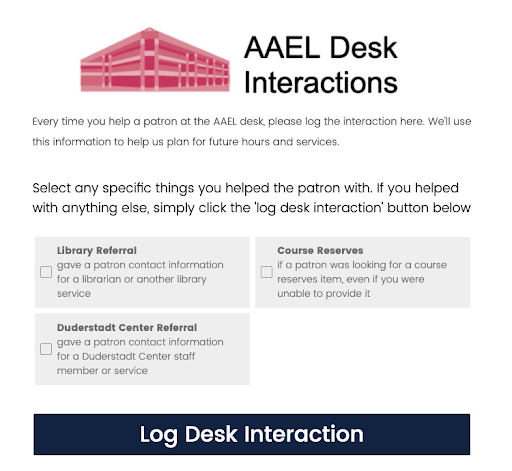
An example of a new location specific desk interactions form
Frequency of Gate Counts
Gate counts are no longer aligned across locations. Some library locations have had new automatic counters installed that eliminate the need for manual collection altogether, while other locations are entering their gate counts based on the current hours of that location. The counts are collected relative to “open time” and “closing time” instead of to hours of the day.
Head counts/ occupancy data
We aren’t collecting head counts in most locations for now. We are treating this as a targeted type of collection to support specific questions about the use of our spaces and services.
Data Portals
We wanted to close the loop between data collection and information sharing, so that staff collecting the data could see where it goes, and so managers could more easily use the data. To do this we have developed data portals in Tableau, launching in early Winter 2022, that will show useful views of all of a location’s data in a single place, so managers can look up the information whenever they need it. In addition Library Environments will continue to offer ad hoc reports on this data as needed. We anticipate having the correct data in one location will make this faster and easier for us as well.