Doreen R Bradley
Posts tagged with data analysis in Blog Tiny Studies
Showing 1 - 10 of 13 items

Working with large-scale datasets to understand the effect of library resources on student success raises a number of concerns around individual privacy, data security, and analysis. This blog post, summarizing a recent article in College & Research Libraries, describes a recent grant-funded project at the University of Michigan, discusses the steps we took to address those concerns, and some of the lessons we learned.
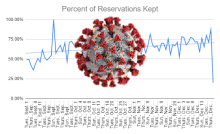
The interruption to library services caused by COVID-19 meant we needed to quickly develop new data collection strategies to give us information to manage our modified services for the 2020-2021 academic year. It also gave us an opportunity to conduct a deep reflection and assessment of how our regular collection had been going, and to be ready to make changes as we reinstituted more regular services. In two posts, we describe the evolution of our data collection efforts.

The interruption to library services caused by COVID-19 meant we needed to quickly develop new data collection strategies to give us information to manage our modified services for the 2020-2021 academic year. It also gave us an opportunity to conduct a deep reflection and assessment of how our regular collection had been going, and to be ready to make changes as we reinstituted more regular services. In two posts, we describe the evolution of our data collection efforts.
Between March 20 and August 31, 2020, the University of Michigan Press made all the titles in the Library-hosted ebook collection, UMP EBC, free-to-read. During this period, U-M Press staff gathered use data in the hope of assessing the impact of free-to-read content while informing the future business strategy. Three different assessment efforts are described in this post.
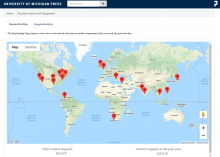
This blog post presents how the use of multiple streams of data benefited two recent U-M Library studies. For example, one recent study merged survey data, U-M human resources data, and Library document delivery data to provide a very rich picture of how diverse groups on campus use and experience the Library’s document delivery service. Some advantages of joining multiple data sources in assessment projects are discussed in the context of the two example studies.
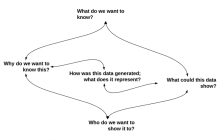
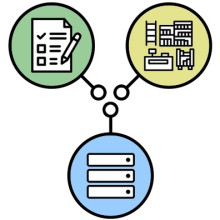
Chances are the work processes you already have in place are generating data that you could be using to learn more about those processes. In this second blog post, the author continues to highlight steps for working with data that is generated by your daily tasks.

Chances are the work processes you already have in place are generating data that you could be using to learn more about those processes. In two blog posts, the author shares some steps for working with data that is generated by your daily tasks.
Assessment and research activities focused on the U-M Library faculty, staff, and student experiences are happening regularly, and often the Library Human Resources (LHR) team is contributing to these activities if not leading the research. This work can focus on quantitative data, qualitative data, or take a hybrid approach, and can involve surveys, interviews, and/or some general number-crunching. This post looks over some recent HR assessment projects.
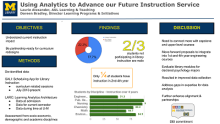
The 2018 Library Assessment Conference (https://libraryassessment.org/) brought together a community of practitioners and researchers who have responsibility or interest in the broad field of library assessment. This post recaps the conference poster content presented by Laurie Alexander and Doreen Bradley about how analytics advanced the Library's internal understanding of the course-integrated instruction provided by Library staff.
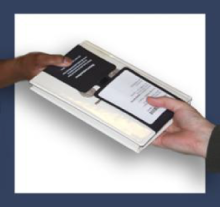
Document Delivery provides traditional Interlibrary Loan Borrowing service, and scanning and delivery service for books and articles from material owned by the U-M Library. As a result of a successful pilot to provide free Local Document Delivery for faculty and graduate students, the department next sought to change the fee-based service for undergraduate students and staff. Departmental managers wondered: What would happen if we made scanning and delivery service free for these patron groups?