Kat King
Posts tagged with data analysis
Showing 11 - 19 of 19 items

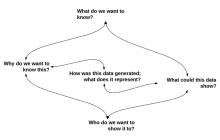
Chances are the work processes you already have in place are generating data that you could be using to learn more about those processes. In two blog posts, the author shares some steps for working with data that is generated by your daily tasks.

Assessment and research activities focused on the U-M Library faculty, staff, and student experiences are happening regularly, and often the Library Human Resources (LHR) team is contributing to these activities if not leading the research. This work can focus on quantitative data, qualitative data, or take a hybrid approach, and can involve surveys, interviews, and/or some general number-crunching. This post looks over some recent HR assessment projects.

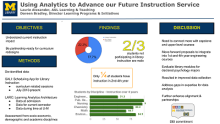
The 2018 Library Assessment Conference (https://libraryassessment.org/) brought together a community of practitioners and researchers who have responsibility or interest in the broad field of library assessment. This post recaps the conference poster content presented by Laurie Alexander and Doreen Bradley about how analytics advanced the Library's internal understanding of the course-integrated instruction provided by Library staff.

Document Delivery provides traditional Interlibrary Loan Borrowing service, and scanning and delivery service for books and articles from material owned by the U-M Library. As a result of a successful pilot to provide free Local Document Delivery for faculty and graduate students, the department next sought to change the fee-based service for undergraduate students and staff. Departmental managers wondered: What would happen if we made scanning and delivery service free for these patron groups?

Not everything a library wants to know is available via web-scale analytics tools such as Google Analytics. Often, custom instrumentation and logging are the best way to answer usability and analytics questions, and can offer better protections for patron privacy as well.
•
As a Library Environments Support Team member-- everything I do, centers around delighting the students and faculty and creating environments conducive to sharing, learning, growing, and accessibility. From observing how many people use the book drop box, to helping to create a workshop dedicated to having students envision their perfect “Library of the Future.”

There are many ways to record and analyze what is happening in the University of Michigan libraries over time. The more we understand how users are engaging with our spaces, the more we can do to meet their needs. But how do you get a handle on such a big question (library space use)? What data do you collect and how do you break it down?

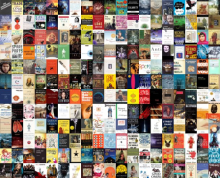
The U-M Shapiro Undergraduate Library (UGL) collection serves the course-related and extracurricular information needs of U-M undergraduate students. This collection encourages students to explore new ideas, gain research skills, and become lifelong learners. How can we tailor this small collection (approximately 175,000 volumes) to meet their current needs?

Quantitative data gives you the hard numbers: what, how many times, when, generally who, and where. Quantitative data also leaves out the biggest and possibly most important factor: why.