Ben Howell
Posts by Ben Howell
The second Library Search Benchmark Survey launched earlier this year and we gathered feedback from students, faculty, staff and library employees about finding and accessing materials through Library Search. We also measured changes in user satisfaction, ease of use, user challenges and wins from our first survey in 2022. Participation from users outside the library grew significantly and responses helped us identify clear and actionable insights we’re excited to share and act on in the coming year.
What are the main characteristics of search queries submitted from the “What can we help you find” search in the lib.umich.edu homepage, and how relevant are results in our U-M Library Search “Everything” results? Learn how our small team gathered, categorized, and analyzed queries, and their results to reveal trends and insights from search query behaviors that will help us improve people’s experience finding promising materials in the Library.

Part 2 of the series "Uncovering Needs of Filipino Researchers with our Philippines Digital Collection" explores a UX research study aimed at improving the University of Michigan’s Philippines digital collection interface. The study initially focused on understanding user pain points with the legacy collection interface. Following the launch of a redesigned interface, short-term fixes were implemented based on user feedback, while long-term needs were documented for future platform updates.
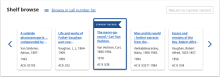
How we designed and built our “nearby on shelf” feature for Library Catalog records.
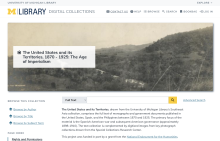
In June 2003, the University of Michigan Library launched the Philippines digital collection, “The United States and its Territories, 1870 - 1925: The Age of Imperialism.” Featuring over 4,000 historical texts, it has seen significant engagement from Filipino users for twenty years. Contextual inquiry interviews with Filipino researchers revealed their appreciation for the preservation and access to historical materials, their enthusiasm for being included in research and design activities and opportunities to improve usability in specific areas. Our findings show the importance of enhancing digital collections to support researchers and preserve cultural heritage, especially for communities who have experienced the loss of these materials in their country of origin.
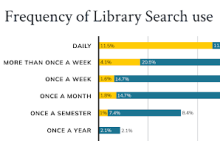
The U-M Library UX + Design Team conducted a benchmark survey in late 2022 aiming to understand people’s experience with Library Search. Objectives included measuring user satisfaction, identifying audience needs, and comparing results with Harvard University’s survey using the same methodology. Survey findings guided the development of the Library Search Product Statement as well as user centered improvements such as implementing LibKey Direct-to-PDF API, and refining catalog results filters.

How can we improve the familiarity and credibility between Library experts, resources and services we offer and the students, faculty and staff who use them? Whether we’re building new relationships or reconnecting with patrons/colleagues during assessment or user research activities, we have the opportunity to use certain marketing and communication best practices and tools during our user research to align clear and targeted communication with our key audiences.

Web accessibility is a key ingredient to successful product development that can make or break many peoples’ experience. The U-M Library Digital Accessibility Team (DAT) helps library teams 'bake in' web accessibility from the beginning of their projects and helps coordinate accessibility work across the Library. Read about DAT's services and how collaboration with teams and staff across the library has led to improved products and services for our Library staff, faculty and students.

Maybe you’ve heard of or lived with a roommate who never washed the dishes, who talked loudly on the phone late into the night or who stiffed you on rent. Not fun. Bias in our research isn’t fun either. It distorts the nature of the data we collect, analyze and share.
How does a library present the right information to patrons at the right time and place in the face of changing services, new technologies and vendors? User Journeys provide a way to create and improve what information, services and tools will help users on their path to the resources and services they seek. Find out what insights our team gained from developing User Journeys and we'll tell you about tools, resources and templates you can use to make your own!