Introduction
In the humanities, the monograph often acts as the lab where scholars experiment and engage with other thinkers. Despite the valuable ideas emerging from these fields, the academic community has struggled to find sustainable ways to make humanities monographs open access. Grant money and other funding is often less available to these scholars than to their counterparts in the sciences. As a result, the academic and publishing communities have had to explore new ways to make the turn to open. Fund-to-Mission from the University of Michigan Press is one such project to open the humanities.
Methodology
We first inventoried the data available, which consisted of the following:
- Usage information from platforms where the open access books were hosted, especially Fulcrum and JSTOR.
- Citation information from the Dimensions index and indicators of online engagement from the companion Altmetric.com explorer.
- Responses to an online survey hosted in Qualtrics that users of open access books on Fulcrum were prompted to take.
The first stage in data processing was data classification. For example, book views and requests were separated into different categories (i.e., open access and restricted), and sorted by book title. Other attributes such as user countries and book funders were included when this information was provided by the platform. Various time series and regression analyses were then conducted on the data.
Findings
The impact of open access facilitated by the Fund to Mission initiative appears in four ways.
- Open access facilities information exchange.
We first compared the open access and restricted publications through the total “investigations” and “requests,” two measures of different types of online behavior defined by the international COUNTER standard.
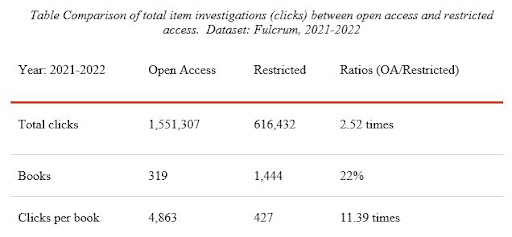
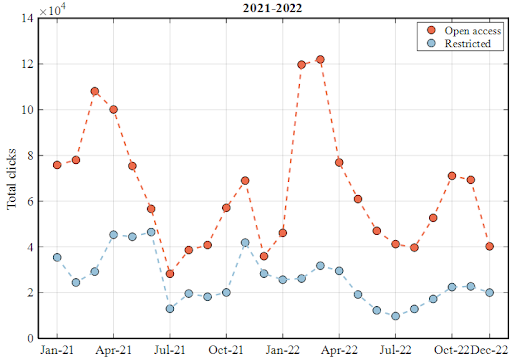
The number of total item investigations (clicks) per book of open access publications is 11 times more than restricted access books on the Fulcrum platform.
Instead of the total clicks, we can also demonstrate the total item requests, which combines all requests for or interactions with a title. In other words, it would add up all full-text views plus chapter downloads (plus print requests, etc.). The total item requests per book of open access publications are 25 times more than restricted access versions.
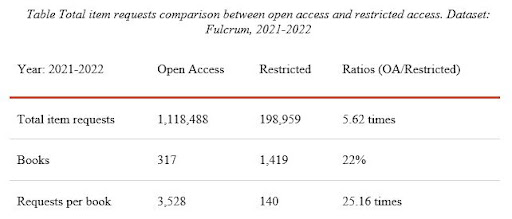
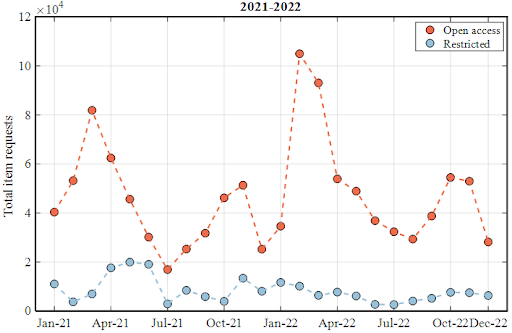
Figure: Comparison of total item requests. Dataset: Fulcrum, 2021-2022
We also explored the “access denied” count with the thought that this is a good measure of ease of access to the books. In 2022, the access denied count demonstrates a decaying trend, indicating that most requests are satisfied. This makes sense due to more books made available through the Fund-to-Mission program. Although the finding may seem obvious, this graphical rendering of the reduced “friction” users encounter with open access is compelling for any reader who has ever been frustrated by needing a resource that they cannot obtain.
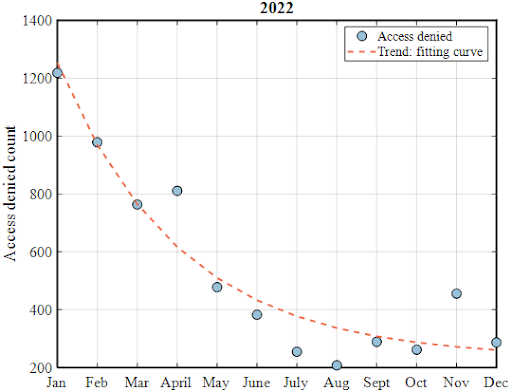
Figure The access denied count. Dataset: Fulcrum, 2022
- Open access increases global reach.
We compared the usage data between open access books and restricted books in JSTOR where the country from which use originated is consistently recorded. Results show that the open access books have been accessed in many more countries than the restricted access books that are mainly exchanged inside the USA.
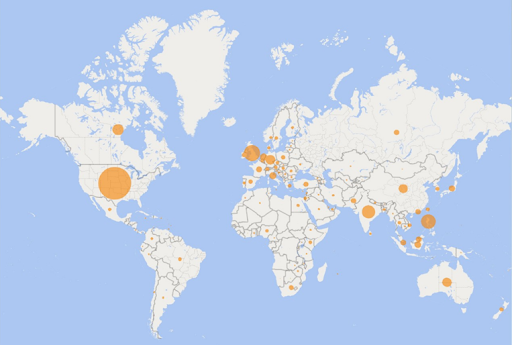
Figure Usage of open access books from different countries. Dataset: Jstor, 2022
- Open access elicits positive responses from readers.
Between May 2020 and the end of January 2023, 2,022 responses were received from readers of University of Michigan Press open access titles. We analyzed this data, exported from Qualtrics.
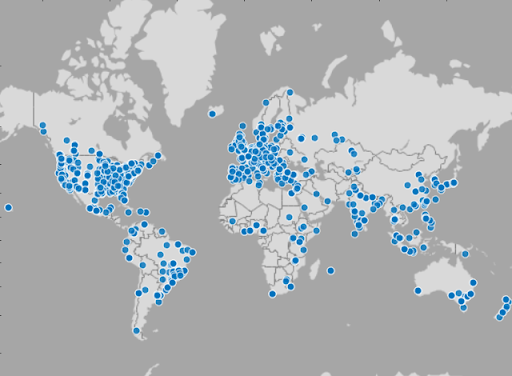
Figure Fulcrum free Ebook survey from all over the world (Reviews related to Michigan publisher from May 2020 to Jan. 2023)
“I REALLY appreciate that this is open access. I am an independent researcher and academic books are expensive.”
Thanks from all over the world
- “As a graduate student, I appreciate that I can access an assigned book for free. Thank you for this gift!”
- “I live in Brazil, and I just finished my PhD studies. I’m not in the job market yet. I really appreciate the availability of books made by you. Congratulations.”
- “I’m really grateful for your generous offer of this precious platform. Bless you.”
- “I’m excited about the book and was excited to see I could download an open access copy…”
- “I greatly appreciate it that the U of Michigan P[ress] is committed to disseminating cutting-edge researchers in this manner…This is all the more admirable given the tight financial situation in academia these days…”
- “I REALLY appreciate that this is open access. I am an independent researcher and academic books are expensive.”
The publisher “Michigan” received positive reviews, and the keyword “thank” occurs 215 times in our readers’ responses.
- Open access is becoming the dominant mode of publishing.
To provide context to the Michigan data, we plotted the overall increase in open access publishing using data from the Dimension platform in various ways.
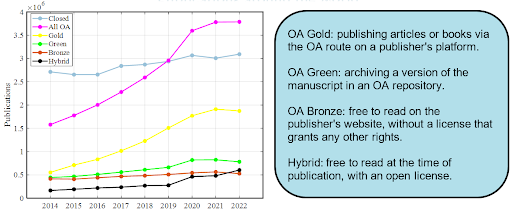
Open access publishing has continued to increase over the last decade. The total number of texts published open access exceeded the restricted (closed) approach in 2019.
Conclusions
Overall, we demonstrated several ways of visualizing the impact of the Fund to Mission initiative to the Provost. Four different aspects of this story were told by analyzing data from different sources.
- Open access facilitates information exchange.
- Open access increases global reach.
- Open access elicits positive responses from readers.
- Open access is becoming the dominant mode of publishing.
Moving from metrics and indicators to telling stories of impact is essential to demonstrate to funders of open access that they are getting a positive return on their investment. This tiny study suggests some stories that can be told using the data available to the University of Michigan Press. It also illustrates the value of enlisting the help of a diverse range of early career experts in understanding the impact of our work at U-M Library. The focus on quantitative data in this tiny study complements another recent piece of work by Rackham doctoral intern Joseph Frankl which focused on author attitudes and has recently been published in the Journal of Electronic Publishing.
Questions? Please contact corresponding author: Kelsey Mrjoian, kmrjoian@umich.edu