Kat King
Posts by Kat King
The interruption to library services caused by COVID-19 meant we needed to quickly develop new data collection strategies to give us information to manage our modified services for the 2020-2021 academic year. It also gave us an opportunity to conduct a deep reflection and assessment of how our regular collection had been going, and to be ready to make changes as we reinstituted more regular services. In two posts, we describe the evolution of our data collection efforts.
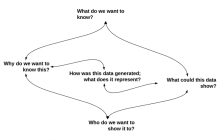
Chances are the work processes you already have in place are generating data that you could be using to learn more about those processes. In this second blog post, the author continues to highlight steps for working with data that is generated by your daily tasks.

Chances are the work processes you already have in place are generating data that you could be using to learn more about those processes. In two blog posts, the author shares some steps for working with data that is generated by your daily tasks.