Introduction: Framing the Big Questions
Back in 2022, our UX Team in Design and Discovery wanted to answer a simple but important question: How do library users rate their experiences and satisfaction using Library Search? Using a benchmark survey Harvard Library adapted from the SUPR-Q (Standardized User Experience Percentile Rank Questionnaire) instrument, we collected responses from over 400 students, faculty, staff, and library employees. While users deeply valued the breadth of resources and matches for specific articles and books that Library Search provided, they said they struggled with “duplicate” results, navigating confusing access paths, and distinguishing between digital and physical results and holdings.
Over the last three years, the Library Search team has worked hard to develop solutions to these and other user challenges. This included:
- Simplifying catalog availability filters and displaying when items were available online.
- Removing HathiTrust search-only links from catalog search results to ensure all links lead to electronic full text or request options for physical items.
- Adding “View PDF” links to article records to improve ease of access.
- Displaying short descriptions of search categories in Everything results to help new users understand how Search results are organized.
Last winter, we re-ran the benchmark survey to measure how people’s experiences changed. How did our work make a difference? Are users finding Library Search easier and more effective? And most important, what opportunities can we act on to improve people’s experience and use of materials found through Library Search?
How We Did It: Survey Design and Participation
To measure changes over time, we kept the 2025 survey largely identical to the 2022 benchmark instrument. Using consistent survey questions gave us reliable comparisons, while a few small UX tweaks, such as clearer wording and streamlined response options, made the survey easier to complete.
The biggest survey design change was a new section gathering people’s self-reported use of AI in their academic research. These responses informed and complemented small-scale qualitative research we did in early summer 2025 and provided valuable insights into how library employees, students, faculty and University staff feel about and integrate AI tools into their research and professional workflows.
Survey participation nearly doubled, with over 750 responses compared to about 400 in 2022. Responses shifted toward end users, especially undergraduates, graduates, and faculty, while library employee participation dropped from 20% to 5% (from approximately 86 participants in 2022 to 35 in 2025). We expanded our recruitment efforts to Library colleagues and to campus through presentations and invitations to library groups. Our librarian colleagues emailed lists of undergraduate and graduate students who had participated in library instruction sessions covering Library Search. Unfortunately, we didn’t see as many library employees participate in the survey. As a result, the 2025 survey findings largely reflect library end user experiences, perspectives, and usage more than those of internal library employees.
What We Found
Changes in Library Search Usage 2022 vs 2025
Overall Library Search usage declined significantly between 2022 and 2025. Weekly or more usage of all respondents dropped from nearly two-thirds (66%) in 2022 to under half (48.8%) in 2025. Daily usage also fell from 23% in 2022 to 12.2% in 2025. This decline may partially reflect fewer library employee participants in the 2025 survey. However, excluding library employee responses, weekly or more usage still fell from 65% in 2022 to 52% in 2025.
The frequency that different audiences reported using Library Search varied dramatically. Undergraduate students showed the steepest decline, with weekly usage dropping 10 percentage points (from 35% to 25%) and monthly usage decreasing 9 percentage points (from 61% to 52%). Graduate students had a more modest decline, with weekly usage dropping 8 percentage points (from 72% to 64%) and monthly usage decreasing 4 percentage points (from 88% to 84%). Faculty usage remained most stable, with weekly usage decreasing only 2 percentage points (from 75% to 73%) and monthly usage declining 3 percentage points (from 91% to 88%).
Despite lower overall frequency of use, satisfaction scores improved across all groups. This suggests users are completing tasks more efficiently, requiring fewer repeated sessions to accomplish their research goals. The data indicates a shift toward more effective interactions with the Library Search platform, with usage patterns becoming more targeted and purposeful across all user groups.
Search Result Preferences
Survey data also showed a change in how people engage with different search result views. Our survey had several questions about which search results people preferred. User preference for the “Everything” results grew from 44% in 2022 to 51.8% in 2025. Use of other search categories or tabs like Catalog and Articles declined slightly. Students and faculty reported liking the broad scope of “Everything” results, but they continued to report challenges with duplicate results across search categories, multiple similar records in the same category, and indistinguishable holdings locations and links. Other common user challenges could have contributed to lower preference for specific search results like catalog and articles including confusing labels, and challenges scanning text-heavy results pages and item pages for promising results.
SUPR-Q Scores
The SUPR-Q instrument measures seven key dimensions: overall satisfaction, ease of use, ease to navigate, comfortable finding materials, clean and simple user interface, attractive interface, and likely future use. User responses from the 2025 survey showed both important shifts and stability in people’s current experiences with Library Search.
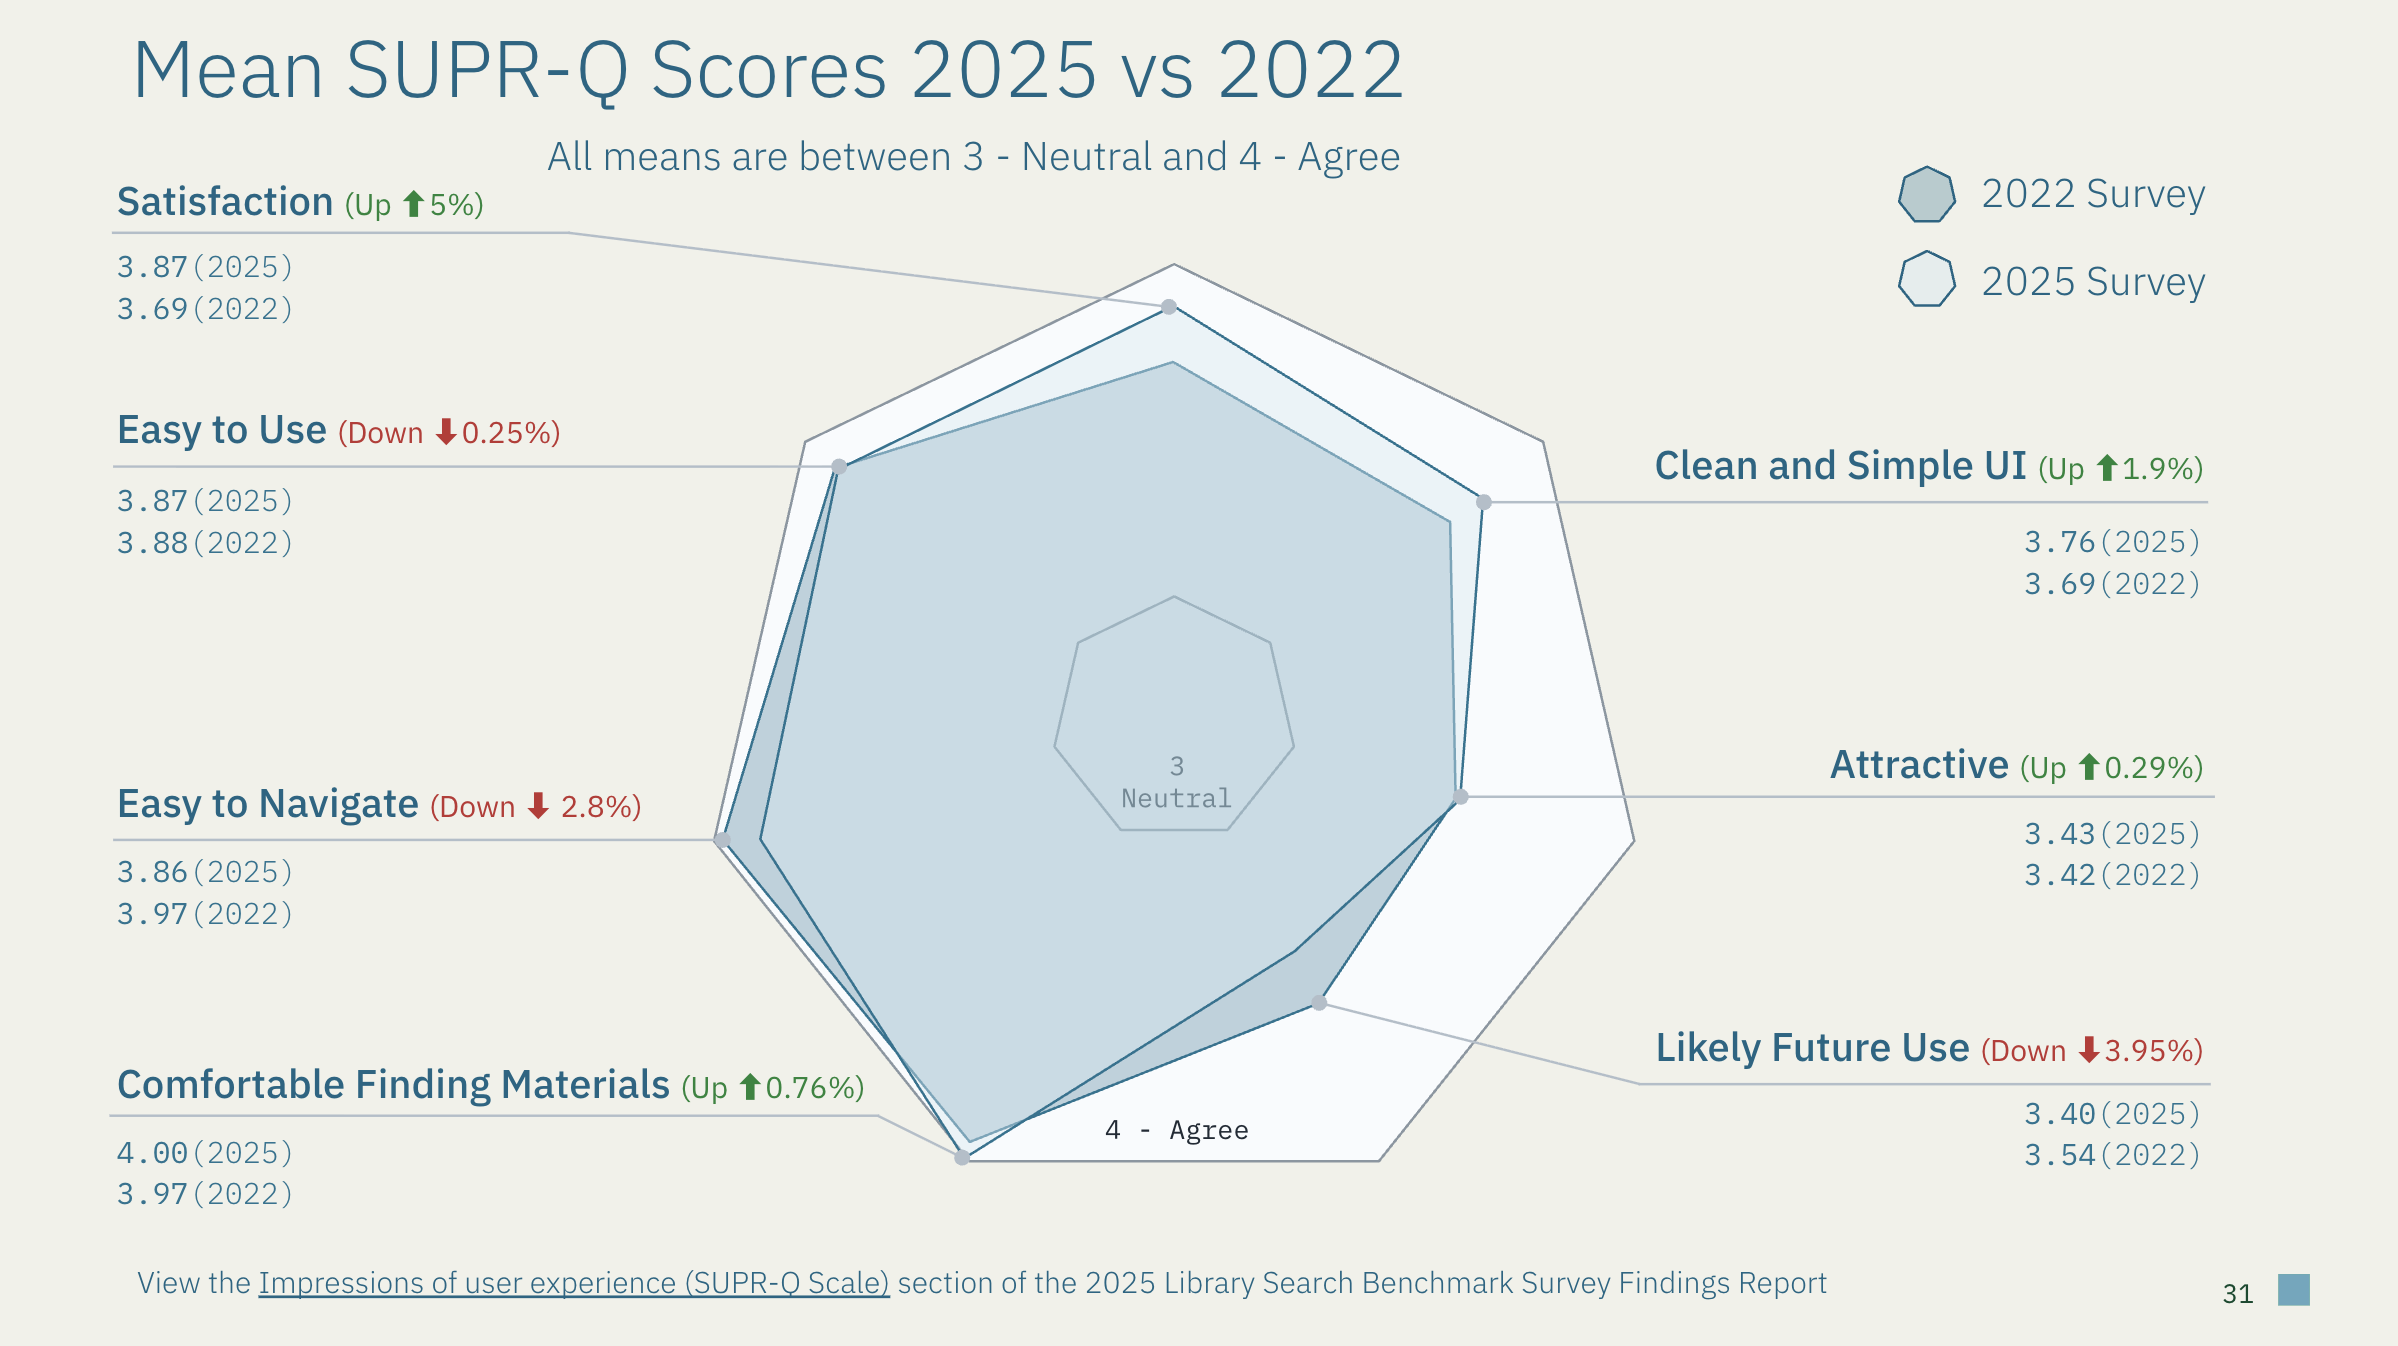
Figure 1. Changes in the mean SUPR-Q scores from 2022 to 2025 show shifts in user rankings for Library Search in different categories. In particular, gains in satisfaction and interface clarity balanced by increased navigation and retention challenges.
Satisfaction improved: Overall satisfaction increased by 5%. These gains reflect improvements we made in response to top user challenges in 2022. Key changes include clearer availability filters, direct “View PDF” links, and removal of confusing “search-only” HathiTrust holdings and links.
Navigation challenges remained: Scores dipped slightly in “ease of navigation” (-2.8%) and in “likelihood to use Library Search in the future” (-3.95%). Undergraduates and newer users reported lower confidence and less intent to revisit, while advanced researchers consistently rated usability and engagement higher. This gap highlights the need for clearer in-context guidance, and more intuitive design for first-time or infrequent users who are less familiar with library research.
Stable areas: Ratings for ease of use, comfort finding materials, and attractiveness remained steady across both 2022 and 2025 surveys, changing less than one percent overall.
What the SUPR-Q scores mean: The trends show that satisfaction can increase even as the system ages, when user feedback directly informs prioritized improvements. Our next steps focus on increasing people’s “intent to revisit” and making the interface more welcoming by aligning our visual design with the Library Design System, streamlining paths to electronic full text, and providing more context-aware onboarding guidance.
Qualitative Feedback: Kudos and Desired Improvements
Our analysis of two key open-ended survey responses revealed some consistent patterns in user satisfaction and frustrations between 2022 and 2025.
What Users Appreciate in 2025: When asked, “What is one thing about Library Search that you feel it does well?” respondents frequently praised the tool's ability to find and access relevant materials (163/467 responses, 35%). Nearly as many responses highlighted its ease and effectiveness (147/467 responses, 32%), while over a quarter appreciated how search results are organized into clear categories such as catalogs, articles, databases, online journals, and guides (122/467 responses, 26%). The quality and breadth of collections also received frequent kudos (83/467 responses, 18%).
Top Improvement Requests: When asked "What is one thing about Library Search that you wish worked differently?", participants' responses (n=486) clustered around four main themes:
- Result organization (70 responses, 14%): Users want clearer organization and elimination of what appears to be duplicate results across and within search categories. Examples include separate results for print and electronic versions of the same item in the catalog, and identical electronic items appearing in both catalog and article results.
- Search precision (67 responses, 14%): Users need more accurate results when searching for specific titles or authors, with better relevance ranking and fewer irrelevant matches.
- System learnability (66 responses, 14%): Users want more intuitive functionality that doesn't require extensive library research training or guidance to use effectively.
- Interface clarity (56 responses, 12%): Users request simpler, less cluttered layouts with more concise presentation and reduced visual noise.
Consistent Themes Across Years: Both surveys reflected very similar user priorities. Strengths remained constant: appreciation for collection breadth, exact match retrieval capabilities, and effective filtering options. Similarly, top improvement requests stayed very consistent: enhanced search precision, duplicate reduction, and streamlined result presentation.
This consistency suggests our users have continuing needs across survey periods for understanding and differentiating between complex and varied library research materials found through multiple databases. This helps our team balance priorities for more novel changes with consistent areas for improvement in our Library Search product roadmap.
AI in Academic Research Questions
This first-time artificial intelligence (AI) survey section in our 2025 Library Search Benchmark revealed important patterns about different audiences' adoption of AI tools. Undergraduate students led overall AI usage at 72.1%, graduate students followed at 62%, while faculty trailed at just 39.4%. Librarian participants reported the lowest usage of AI at just 34%. This inverse technology adoption pattern means librarians have opportunities to deeply understand student AI usage and to integrate much needed guidance for more ethical and effective use of AI tools within library instruction and consultations.
Survey data shows that people from all audiences are sophisticated emerging technology users rather than uncritical adopters. High percentages within each audience report avoiding these technologies within academic research altogether, indicating ethical objections coupled with familiarity with and confidence in traditional research workflows and tools. With sentiment across audiences nearly balanced (43.8% positive, 45.5% negative comments), participants' responses show thoughtful engagement and nuanced understanding of AI limitations. Primary concerns focused on accuracy and skill erosion—reflecting mature risk assessment rather than blanket acceptance or rejection.
Most importantly, the majority of users positioned AI as complementary to traditional research tools, not as a replacement technology. One doctoral student stated: "It's [GenAI] a great tool for initial scoping...but it is not a replacement for traditional research tools/search databases." Users described AI as helpful for brainstorming and understanding unfamiliar topics before engaging Library Search for authoritative sources.
These usage patterns create promising opportunities for our library. Rather than eroding the use of traditional library resources and tools, AI can serve as an accessible and personalized entry point guiding users toward more sophisticated library research practices and tools. Multiple respondents noted using AI for initial scoping, then returning to Library Search for verification, suggesting AI may actually increase library resource usage.
These baseline findings (57.4% overall adoption) establish benchmarks for tracking future AI use trends while positioning libraries as strategic partners rather than opponents to AI adoption. There are opportunities to enhance library services by investigating contexts of how and why users move between AI tools and traditional resources to accomplish their research tasks and goals. The library can identify and test critical intervention points between library tools/services and AI tools typical in user research workflows. We can track whether AI adoption and library interventions correlate with increased Library Search engagement and research quality outcomes over time.
Next Steps
User sentiment, usage, challenges, and desires expressed in Library Search Benchmark survey responses provide critical inputs that have helped us prioritize the following actions.
In the short term we’re redesigning Library Search's visual interface using the Library Design System to address user desires for a more attractive, intuitive experience. In 2026 we will explore ways to help Library Search deal with typos and misspellings and to highlight exact matches at the top of search results. This fall we’re conducting exploratory research and technical investigations about a Library Search AI chatbot that could enable natural language prompts from users. Finally, we’ll prepare for the 2026-2027 Library Benchmark Survey by identifying improvements to our survey instrument, recruitment partners, and analysis tools.
Acknowledgement
I used Claude Sonnet 4 to brainstorm an outline for this article, to experiment with how to describe numerical data from the survey and to refine and edit my content for legibility within different sections.
This research was made possible through the contributions of many library colleagues. UX Specialists Suzan Karabakal and Ruikun Wang provided invaluable analysis and synthesis of survey results. Robyn Ness supported recruitment efforts and provided the initial survey design and report templates. Ken Varnum offered essential guidance and critical feedback throughout the process, from early survey planning through translating findings into actionable, human-centered improvements.
We're grateful to Craig Smith for expert consultation on survey design and question refinement, as well as funding support for participant incentives that demonstrated our appreciation for respondents' time and honest feedback. Librarians and library staff, including Doreen Bradley and many others, were instrumental in expanding our reach to graduate and undergraduate students through their networks and outreach efforts.
Most importantly, a huge thank you to the 762 students, faculty, staff, and library employees who participated in this survey. Their insights drive improvements to Library Search, and other library services, resources, and tools that benefit the entire university community.