Yulia V Sevryugina
Posts tagged with quantitative
Showing 1 - 10 of 26 items
Chemistry students using GenAI for biochemistry essays quickly learned why citation verification matters. In 456 AI-generated references, nearly half contained fabricated elements, and only about three-quarters of the real citations were relevant to the essay topic. Students found verification frustrating and time-consuming, but it reinforced information literacy, research integrity, and critical evaluation.

What do library users want and need when they contact the Ask a Librarian chat service? This post describes a project to design and deliver a survey to gather information on how the library's reference service is meeting community needs. Survey results identified both demographic and service-oriented trends.
In 2023, the U-M Library conducted its first comprehensive survey across students and employees. This blog post covers my specific research exploring the experiences of people with disabilities in the libraries, and their struggles with accessibility by analyzing data from the campus-wide survey. The goal of this research was to reveal struggles people with disabilities are facing in the libraries. By improving the library spaces with accessibility in mind, everyone – not just those with disabilities – benefits.

As we approach five years since the drastic shutdown and isolation techniques due to the COVID-19 pandemic, it seems appropriate to reflect on an assessment project conducted during 2020-2021. As librarians and students attempted to pivot to an all online learning and teaching experience, research service providers quickly needed to know more about our research consultation service. Struggling with a crisis, we also learned how to conduct assessment work in sensitive and empathetic ways.
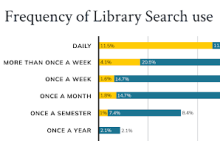
The U-M Library UX + Design Team conducted a benchmark survey in late 2022 aiming to understand people’s experience with Library Search. Objectives included measuring user satisfaction, identifying audience needs, and comparing results with Harvard University’s survey using the same methodology. Survey findings guided the development of the Library Search Product Statement as well as user centered improvements such as implementing LibKey Direct-to-PDF API, and refining catalog results filters.
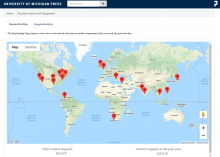
University of Michigan Press is exploring different ways of communicating the “impact” of the open access program, Fund to Mission, with impact defined as “provable benefits on the real world.” As part of this exploration, the Press worked with Zhenkun Lin, a doctoral student from the U-M College of Engineering, under the auspices of the Rackham Doctoral Internship initiative. The charge for Zhenkun’s project was very broad: Please explore the data we have gathered and see if it suggests any interesting patterns or opportunities for visualizing the program’s impact.
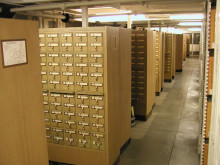
The interruption to library services caused by COVID-19 meant we needed to quickly develop new data collection strategies to give us information to manage our modified services for the 2020-2021 academic year. It also gave us an opportunity to conduct a deep reflection and assessment of how our regular collection had been going, and to be ready to make changes as we reinstituted more regular services. In two posts, we describe the evolution of our data collection efforts.

The interruption to library services caused by COVID-19 meant we needed to quickly develop new data collection strategies to give us information to manage our modified services for the 2020-2021 academic year. It also gave us an opportunity to conduct a deep reflection and assessment of how our regular collection had been going, and to be ready to make changes as we reinstituted more regular services. In two posts, we describe the evolution of our data collection efforts.
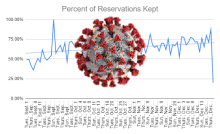
Between March 20 and August 31, 2020, the University of Michigan Press made all the titles in the Library-hosted ebook collection, UMP EBC, free-to-read. During this period, U-M Press staff gathered use data in the hope of assessing the impact of free-to-read content while informing the future business strategy. Three different assessment efforts are described in this post.
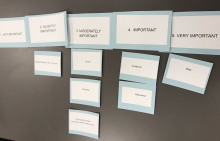
Source evaluation is an important skill in our information landscape, which is why librarians teach this concept to students during course-integrated information literacy sessions. As part of an IMLS grant, our research team is conducting a two part study to understand the impact of library instruction on students’ evaluation of sources. In this post, we discuss the use of a questionnaire and role-playing interviews to learn more about students’ confidence in their evaluation abilities.