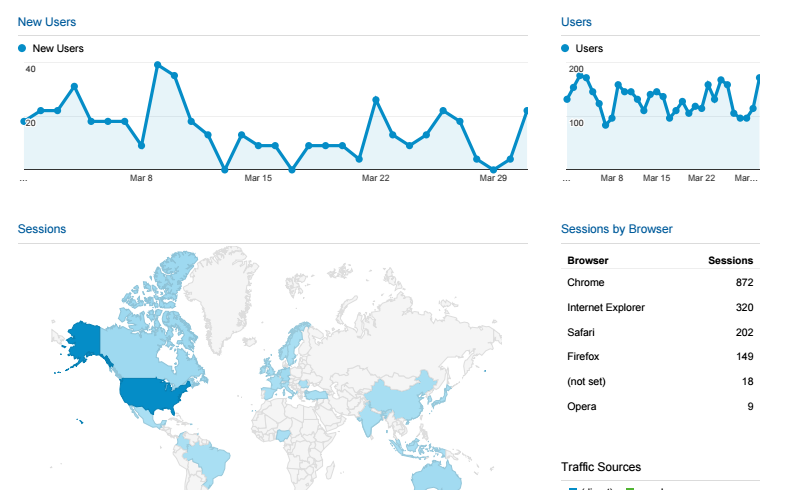
DLPS has been capturing usage statistics on collections from webserver logs for a long time. The different content classes define rules to classify requests into different kinds of "hits" (e.g., image, search, page). Hits are logged with their date to feed summary reports (e.g., this image class report reporting on the counts of search types, image downloads, image tiles, and entries).
Several years ago, we decided to add Google Analytics tracking to both DLPS collections and HathiTrust in order to capture more data. Analytics could cluster reports based on the visitor's language and location, or whether they were new or returning users, or what kind of technology was used.
Our analytics use also needed to serve multiple audiences: developers using data to inform features and design, staff using data for project planning, and content providers wanting insight into how their content was being used.
Implementing Google Analytics
Analytics have a hierarchical setup: accounts contain properties which contain views.
Tracking data is sent to the property. We've defined "custom definitions" to attach additional information to each logged request, e.g., content class in DLPS, or in HathiTrust, the identifiers of the collections to which an item belongs.
The view is what you interact with when using the Analytics reporting tools. This is where you can define filters to tune the data you're collecting: we exclude internal requests to avoid cluttering reports.
It took us a few iterations to settle on our setup: we now track data to a single property. Since filtering on views dumps data, we aim to have one view with minimal filters (e.g., just excluding internal requests). Additional views can have tighter filtering for more focused reporting (e.g., only searches, or only mobile).
Users are managed at the account level, but can be authorized at any level. We can set up a view for a content provider (e.g., UM-Dearborn Newspaper Photographs) and give them access to just their data.
Views can be further divided using segments: segments function similar to views, but are non-destructive to the data. In a view filtered to just the HathiTrust "Ann Arbor History" collection, segments would let us group visits by time, technology, or whether they logged in, and then overlay those segments on top of each other.
What works especially well
From a development perspective, Analytics lets us gauge the kinds of technology that visitors are using to access our sites. It's one thing to know that there are still IE7 requests, but we can also drill down to see which pages those IE7 visitors are accessing. Or to discover that visitors tend to browse far more often in wider configurations than tall and narrow.
With our custom definitions, we can segment our data by content class and compare use across classes (spoiler: Text Class trumps everything else).
Normally, adding Analytics tracking involves just copying and pasting the template Google provides. We've leveraged its API to better tune what we're tracking, like filling in our custom definitions. For tracking item reading in HathiTrust, we've taken to fabricating a URL that works better with Analytics: building the URL context with paths instead of query parameters, and minimizing the data collected to reduce the quantity of URLs submitted (e.g., only track the item and not the exact page).
Many content providers are happy to receive PDF reports in their email. With Analytics, we can create a "dashboard" with the multiple reports and statistics and schedule delivery.

Every month, Google Analytics can generate a PDF from a report and send them via email. Interested parties can get the data they want without having to log into a dashboard.
Too much of a good thing
The free tier in Analytics can capture and report on an amazing amount of data. Still, with our HathiTrust tracking, we are constantly getting a warning about "Too many URLs", and when that happens much data gets lumped into the dread "Other" category.
Behind the scenes, Analytics samples your data to generate reports with reasonable performance (indicated by the alert that the report is based on some percentage of sessions). Because HathiTrust is such a large and diverse set of content, fiddling with that precision can generate vastly different reports, and often times you're still working with a percentage of the data. Questions like How many times have visitors downloaded the full books of this content provider? are difficult to answer with any certainty.
The Analytics platform is always changing, from minor things like the look and position of labels to reorganized sidebars (e.g., the list of URLs visited is now under Behavior). This is definitely a challenge if you step away from Analytics for any length of time, and one reason that the emailed PDF reports have been so well received.
Finally, Analytics is primarily designed to support ecommerce sites. There are features we never use (AdWords, Conversions), and there's no escaping the price Analytics assigns to every URL (spoiler: $0.00).
Beyond Analytics
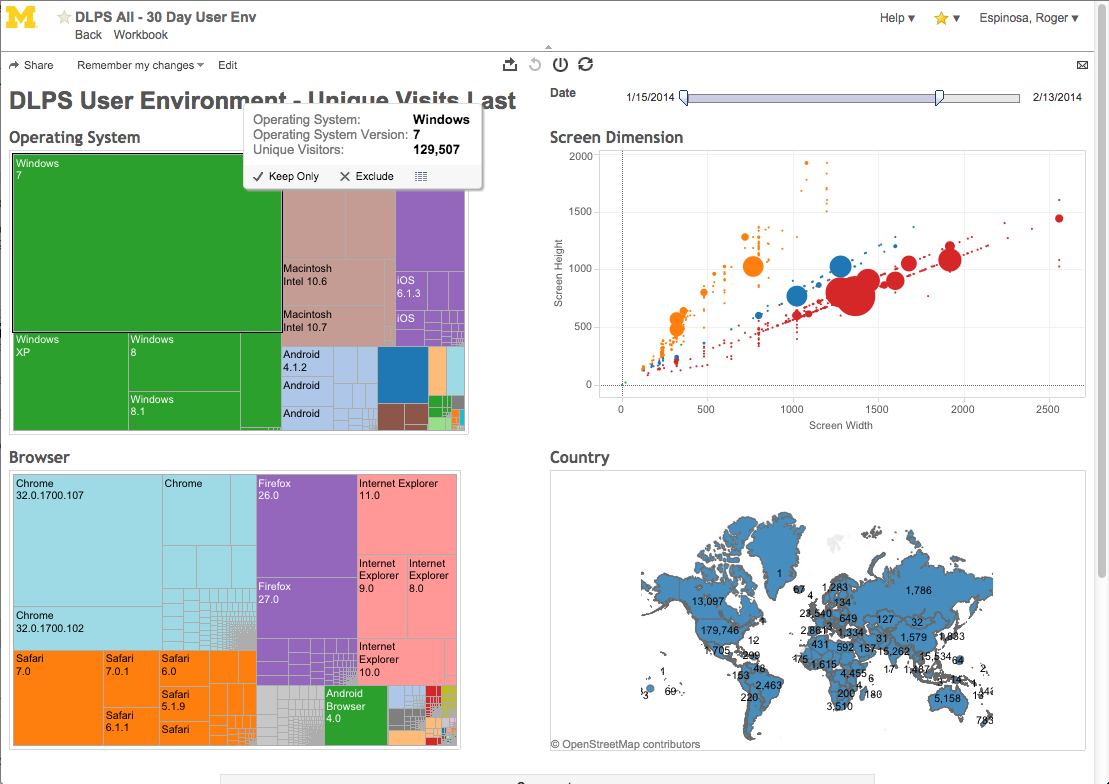
We've made small forays into researching tools that offer better visualizations, e.g. Tableau:

With Tableau, you can interact with multiple reports simultaneously, as well as coordinate analytics data with other data sources.
We're also considering using the Analytics API to more readily extract segmented reports – the downside with segments being you have to define them all in advance. We'll either extract results into a secondary database, or directly into a Google Sheet.