International Love Data Week 2023 is February 13-17, 2023. The theme this year is Data: Agent of Change. We believe that the scholars whose data are hosted in Deep Blue Data are truly agents of change for their fields and their communities. Their data supports groundbreaking research in climate change, urban sustainability, behavioral science, policy change, and more.
Deep Blue Data is a repository offered by the University of Michigan Library that provides access and preservation services for digital research data that were developed or used in the support of research activities at U-M.
In honor of Love Data Week, we reached out to some recent Deep Blue Data depositors to ask about the history of their work, unique discoveries they made along the way, and how they see their data being useful to their research communities and beyond.
We hope you enjoy learning more about the scholars behind the data sets. As a reminder, all data sets in Deep Blue Data are openly accessible for anyone to download and use, because we love data.
Yingxiao Zhang is a PhD candidate in the Climate and Space Sciences department. She deposited her data set entitled "Simulated historical (1995-2014) and future (2081-2100) pollen emission using PECM2.0." This data underlies her journal article in Nature Communications entitled "Projected climate-driven changes in pollen emission season length and magnitude over the continental United States." In this interview, she describes her research and why she decided to share her data set publicly.
What prompted you to conduct your research in this area?
Pollen-triggered seasonal allergy impacts 30% of the world's population and this condition is getting worse due to climate change. To understand how pollen emissions will change in the future and help people prepare for the health impacts, I conducted this research.
For those not familiar with your field, what is the one thing you think is most important, interesting, or unique about your work or your findings?
We find out that future pollen seasons will start earlier, last longer, and become more intense with warmer temperatures and higher CO2 concentrations. These changes will further worsen the future health condition.
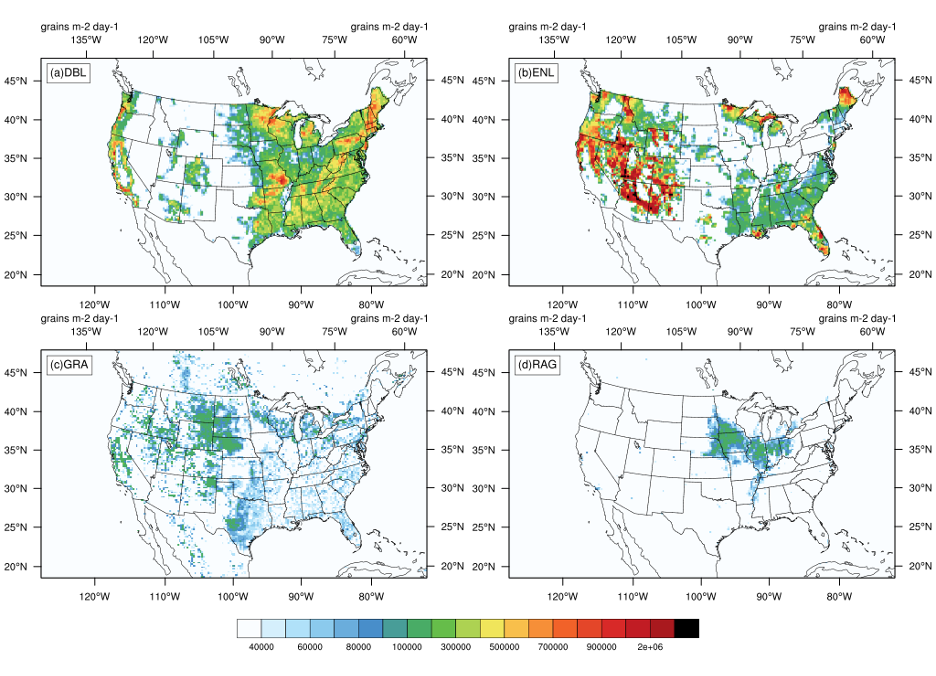
From this data set, Yingxiao created this visualization which shows the multi-model average historical (1995-2014)pollen emission for (a) Deciduous broadleaf forest; (b) Evergreen needle leaf forest; (c) grass, and (d) ragweed.
What impact do you hope making your data public will have in the world? How are you hoping it might be encountered, reused, or built upon?
I hope making my data public can be a starting point for further investigations into the consequences of climate change on pollen emission patterns and subsequent health implications. Additionally, I want to build collaborations and my data can be used to develop climatic sensitive forecasts for pollen.
What is one thing you learned during the process of preparing your data for deposit or sharing?
It is crucial to clearly categorize the data and attach detailed descriptions, which makes the dataset easier to be accessed.
Why do you think sharing data is important?
Firstly, sharing data can improve the impacts of the research, such as building potential collaborations and being used for public communications. Moreover, it also helps other studies to build upon and promotes future research in this field.